For the last 2 week we have been learning about Statistics for Maths. We have been collecting data in tally charts and displaying the information in bar and pictographs.
Birthday Graph. July was a popular month for Team Awa babies to be born.

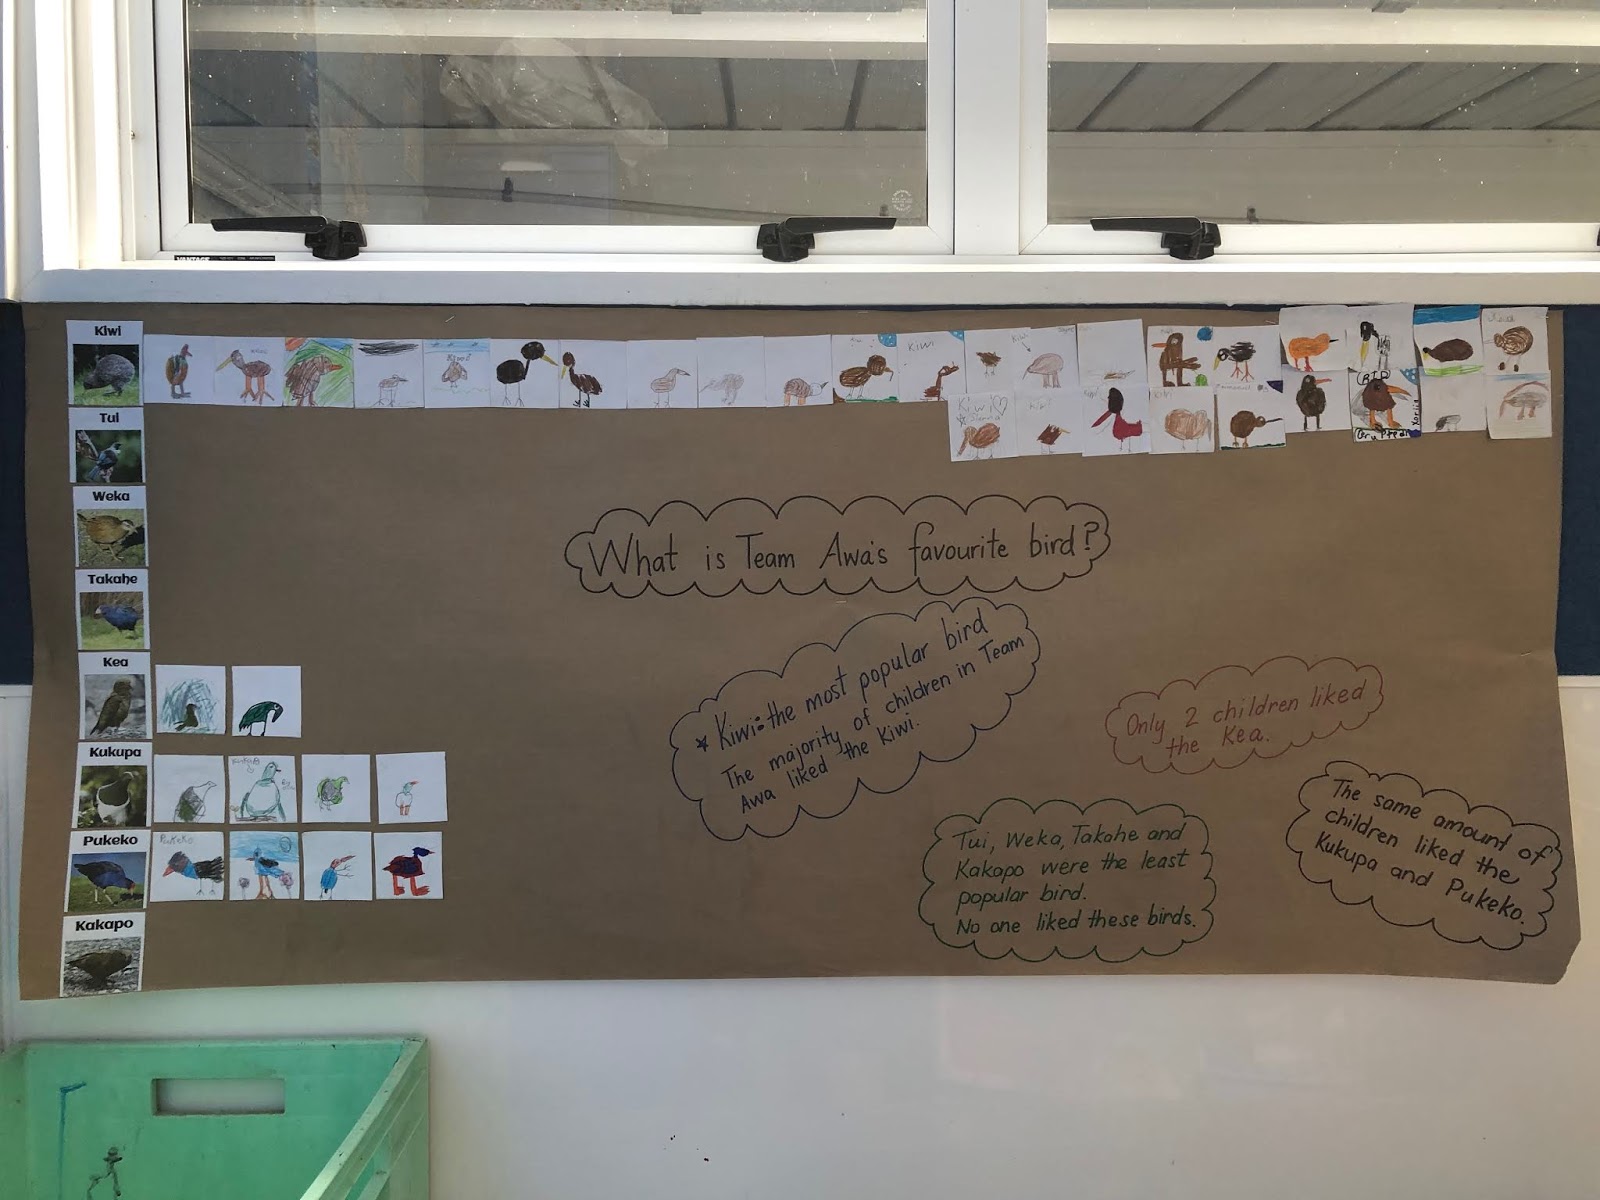
Our favourite bird. Nearly all children loved the Kiwi.
Graph of our favourite Native Trees from around our school.

We investigated the colours of lollipops in a bag.
Here is Maia's graph from her group. Each bag was very different.

We counted the fruit trees in our orchard. Here is Emmanuel's tally chart and graph showing what we found. There were so many trees we had to count in 2's for this graph.


No comments:
Post a Comment